“It’s Growing Exponentially!” That is a phrase that is used all the time, especially as regards topics of science. But what does exponential growth really mean?
Let’s first consider the simpler example of linear growth. Imagine a that a company, we’ll call it the Hand Cream Company, or HCCo, is manufacturing and trying to sell something that is perhaps not its greatest idea: “Yukko Glop hand cream”. HCCo has sold 100 gallons of Glop through existing contracts with stores that agree to buy some of its new products sight unseen, at a deep discount. HCCo assigns a salesperson, Jan, to sell Yukko Glop to more stores for all of 2021. Jan works hard and has talent in sales. Every two weeks Jan manages to convince enough new stores to buy this stuff that HCCo sells 100 more gallons.
But Glop does not appeal to customers. There is no word-of-mouth growth in sales. Jan is just a good salesperson. The total amount of Yukko Glop sold increases by 100 gallons every two weeks, a steady 7.1 gallons per day (100 gal/14 days = 7.1 gal/day). By the end of the year HCCo has sold over 2500 gallons of Glop.
So it is with linear growth behavior. The total sales increases linearly. The daily sales is steady, with no growth at all.
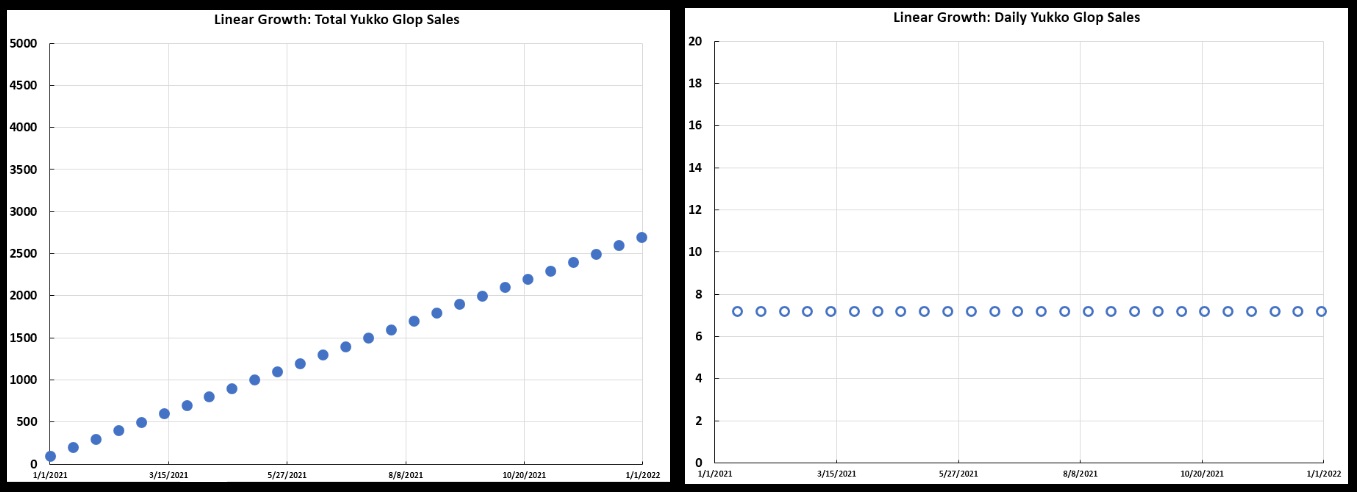 Yukko Glop Sales: at left is the total sales over the year 2021; at right is the daily sales.
But of course, is it realistic that Jan would sell 100 gallons every two weeks like clockwork? No. Two weeks might go by with no sales; in a different two-week period, Jan might sell 200 gallons. There are going to be fluctuations in the sales, even if Jan typically sells 100 gallons every two weeks. That means the growth will not be perfectly linear, and the daily sales not perfectly constant, as seen below.
This is what a scientist might call a pattern of linear growth, with some “noise” in the data. Note how the “noise” is much more visible in the daily sales than in the overall sales.
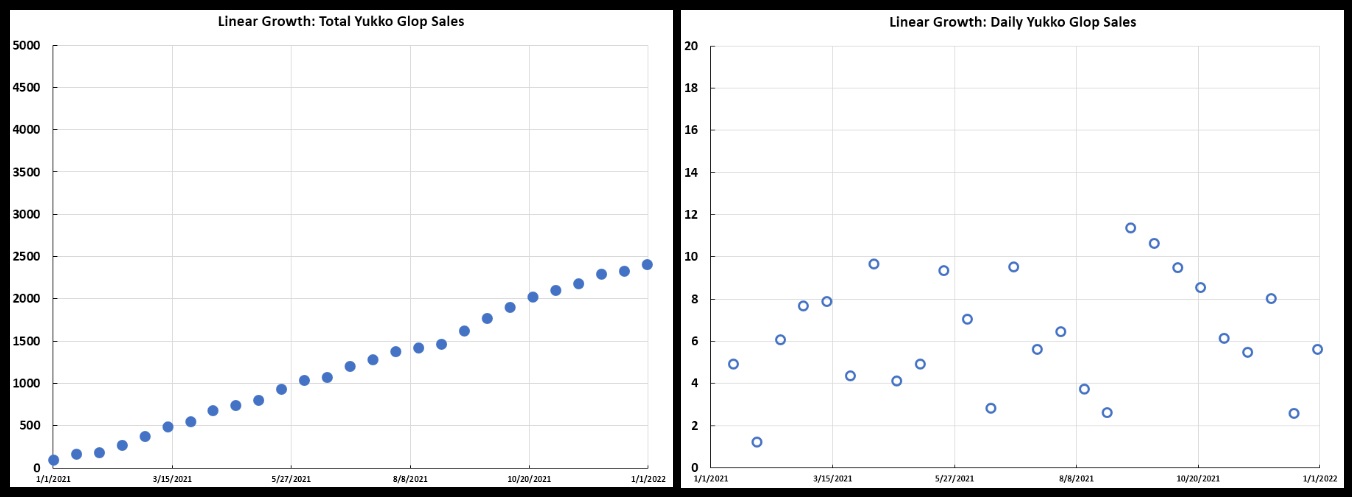 Yukko Glop total sales (left) and daily sales (right) when there is some “noise” in the sales figures.
This “noise” can be described through a “line fit” and a parameter called “R-squared” (or R2), which measures how much the data deviates from a perfectly linear pattern. The graph below shows a line fit and an R-squared for Jan’s sales. The orange graph shows what HCCo was hoping for in terms of Jan’s Glop sales—they were hoping Jan could sell 50 gallons every two weeks. The orange graph is perfectly linear. It has an R-squared of 1, meaning a “perfect fit”. An R-squared of less than 1 is less than perfect. The lowest R-squared can be is 0, indicating no linear trend in the data whatsoever.
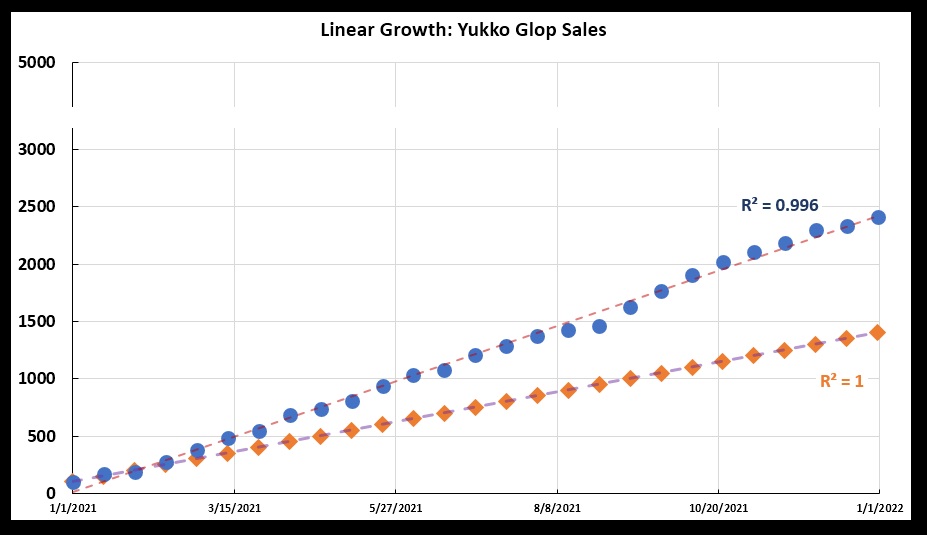 The red line is the “line fit” for Jan’s sales (in blue), with an R-squared of 0.996. The purple line is the fit to HCCo’s expected sales (in orange). HCCo’s sales projections for Jan did not factor in the ordinary variations involved in sales, so the orange graph is perfectly linear, with an R-squared of 1.0.
Now for exponential growth. HCCo also is manufacturing “Hands of an Angel hand cream”. HCCo sells 100 gallons of Angel through existing contracts with stores, but the bosses at HCCo end up deciding that it probably will not succeed, and they assigned no salesperson to it.
However, contrary to those bosses’ expectations, customers love Hands of an Angel. It turns out that in two weeks 15 out of every 100 customers who buy the stuff get a friend to buy it—there is a 15% growth in sales due to “word of mouth”. So after two weeks, HCCo has sold 15 more gallons—for a total of 115 gallons. In the next two weeks the sales grow by another 15%. That is 0.15 × 115 = 17.25 more gallons sold, for a total of 115 + 17.25 = 132.25 gallons sold. 15 gallons in two weeks is 15 gal/14 days = 1.07 gal/day; 17.25 gallons in two weeks is 17.25 gal/14 days = 1.23 gal/day. And so the daily sales, and the total sales, grow by more and more with the passing of time. The numbers keep growing by 15% every two weeks… 115 gallons sold, 132.25 gallons sold, 152.09 gallons, 174.90, 201.14, 231.31….
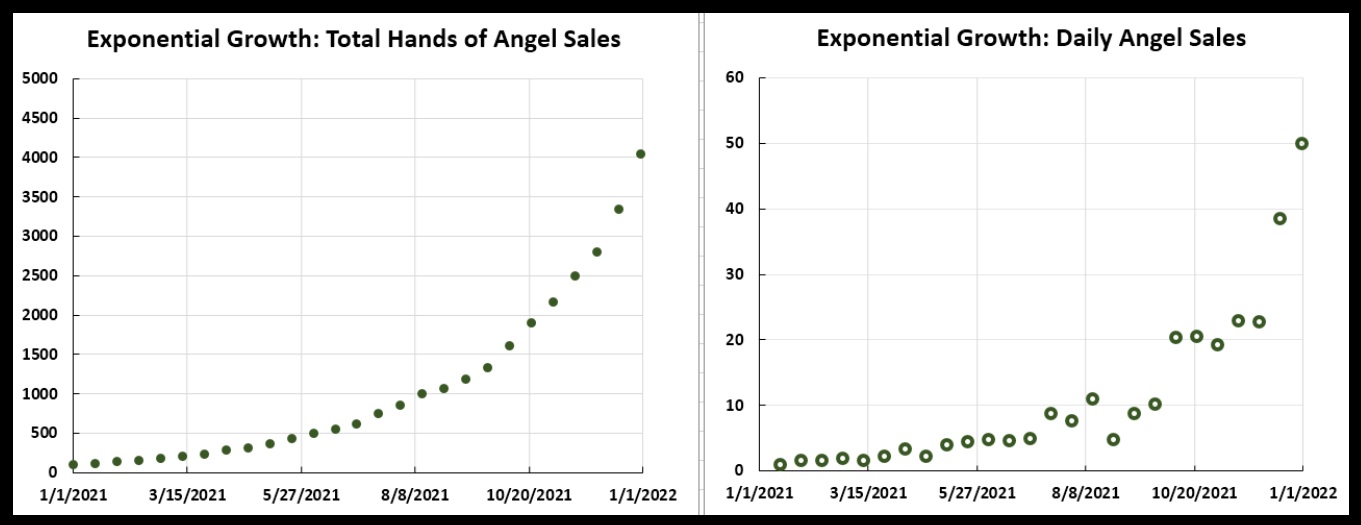
This is exponential growth. And what is interesting about exponential growth is that both the total sales grow, and the daily sales grow, along the same pattern.
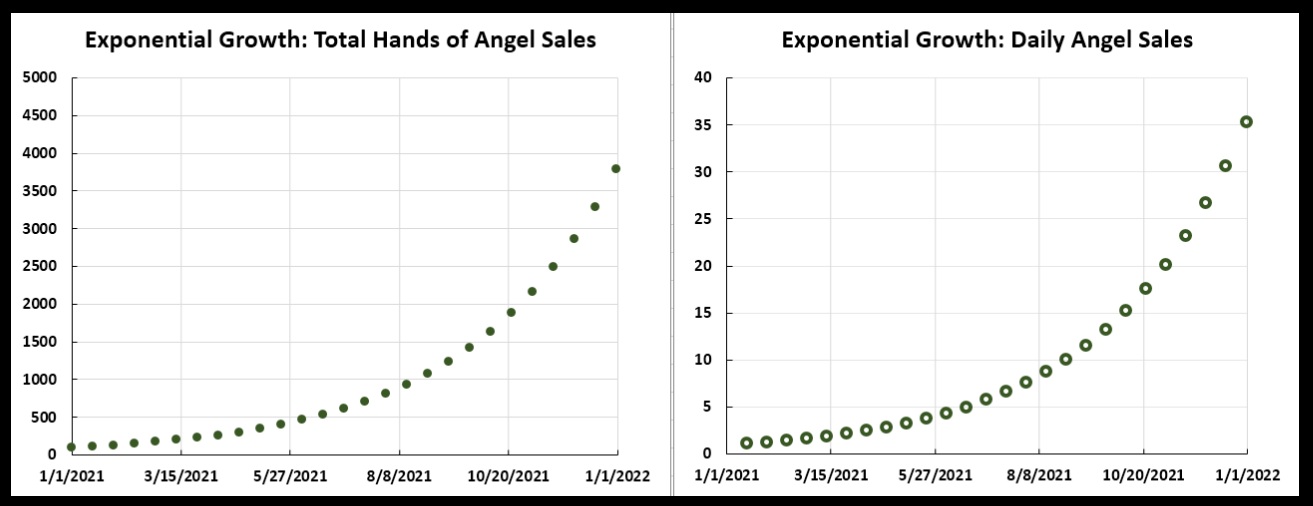 Hands of an Angel sales: at left is the total sales over the year 2021; at right is the daily sales.
Contrast this to Glop’s linear growth, in which the total sales grew, but the daily sales did not. And, even though Hands of an Angel total sales grew by just 15 gallons in the first two weeks of 2021, and by 17.25 gallons in the second two weeks (which are so much less than the Glop total sales, which were growing by 100 gallons per week during those weeks), by the end of the year HCCo had sold over 3500 gallons of Angel, versus 2500 gallons of Glop.
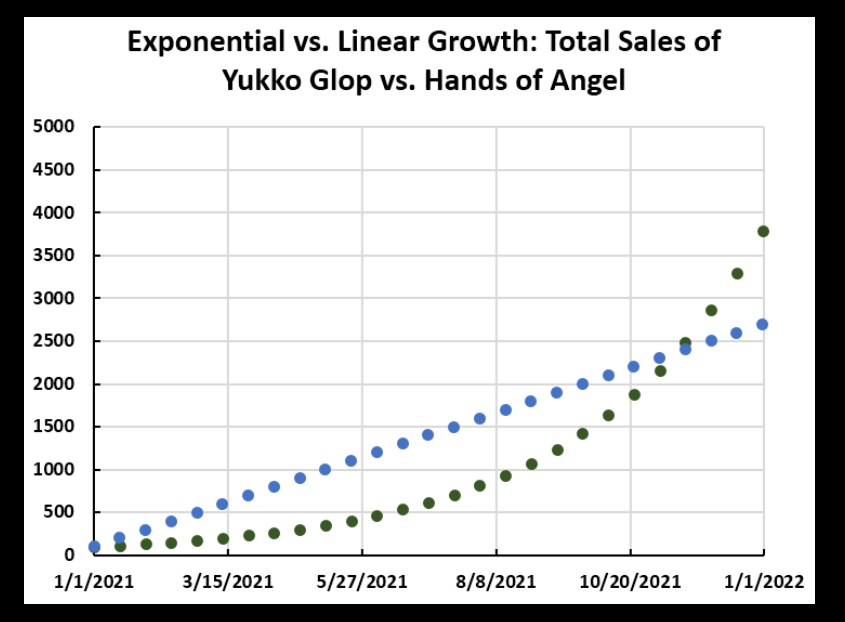 Yukko Glop is in blue, Hands of an Angel is in green. By the end of the year, Angel sales have surpassed Glop, just on “word of mouth” growth, and the future looks bright for the Angel product. Glop sales will die as soon as Jan stops talking stores into buying the stuff.
Now, it was not realistic for Jan to sell 100 gallons every two weeks like clockwork, and it is not realistic for Hands of an Angel to grow by 15% every two weeks like clockwork, either. There are going to be fluctuations, even if Angel sales typically grow through word of mouth by 15% every two weeks. Two weeks might go by with little growth (if there is a spate of bad weather, for example), or the growth might approach 30%. That means the growth of Angel will not be perfectly exponential, and the daily sales will not either, as seen in the next graph.
This is what a scientist might call a pattern of exponential growth, with some “noise” in the data. And as in the linear growth case, the “noise” is much more visible in the daily sales than in the overall sales.
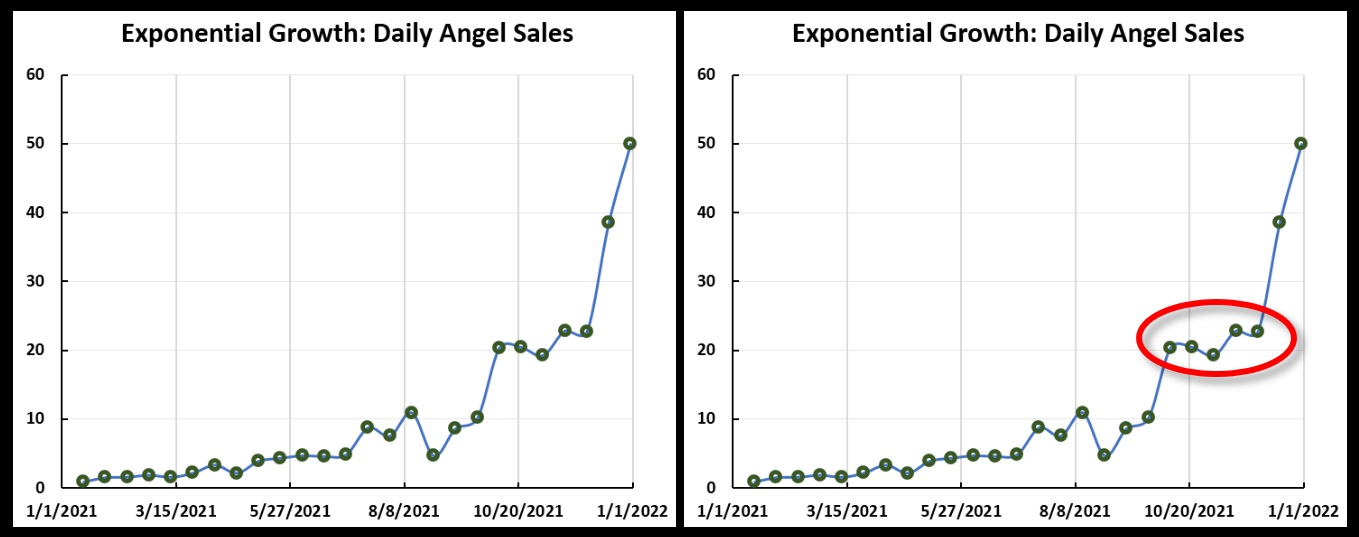
 Hands of an Angel sales when there is some “noise” in the sales figures.
Note that in those daily sales figures there appear to be periods of better growth and worse growth. This stands out more if we “connect the dots”, as seen below, at left. Note in particular the 10-week period of early October through early December (circled in red, at right). Growth in daily sales was pretty flat then. It had been “doing really well” before that, and it “took off again” after that. HCCo might attribute some significance to this, but it is purely the result of “noise”; if you toss a coin twenty-five times, you will likely find that the same side comes up several times in a row.
 As in the linear case, “noise” can be described through a “exponential fit” and an R-squared parameter, which measures how much the data deviates from the perfectly exponential pattern. The graph below shows this for Hands of an Angel sales. The dark purple graph shows what sales would have been like if the growth was 10% every two months, rather than 15%, with no noise.
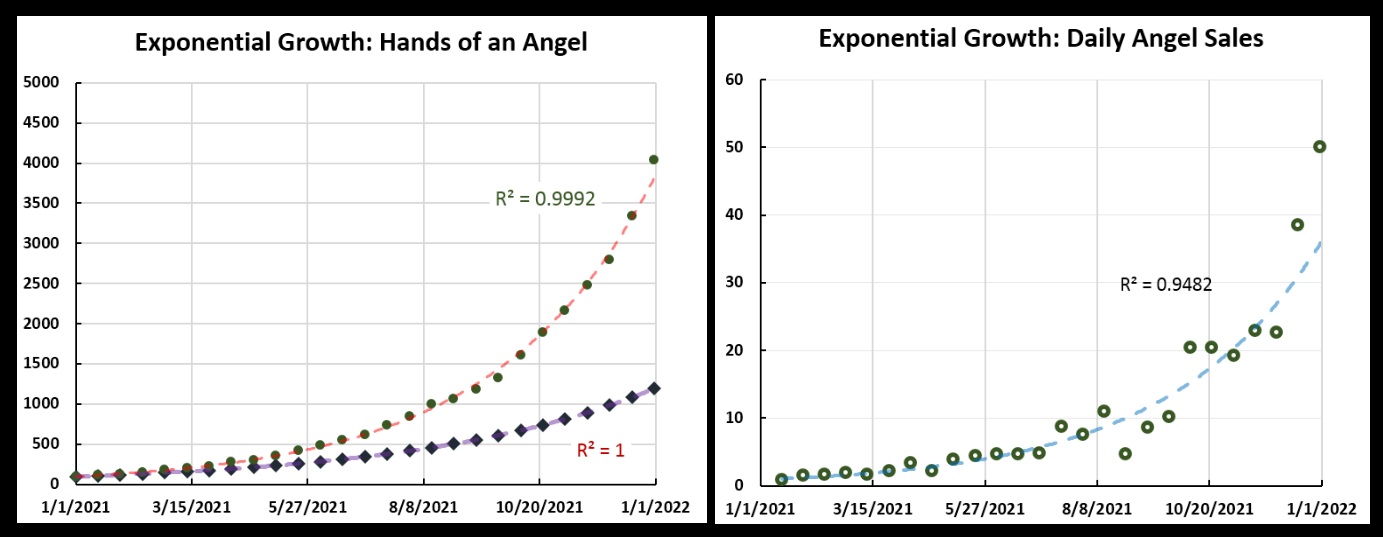 Left: The red line is the “exponential fit” for Hands of an Angel sales (in green), with an R-squared of 0.9992. The purple line is the fit for a perfect exponential sales growth of 10% every two weeks (in dark purple), so the R-squared is 1.0. Right: An exponential fit for the daily sales, with an R-squared of 0.9482, reflecting the greater noise in the daily sales.
An interesting thing about exponential growth is that if you plot it on a chart where the scale is “logarithmic” (exponents and logarithms being mathematically related), it will look like a line. Below are the same graphs as above, but plotted on logarithmic scales. On a log scale, each mark is not the same number greater than the previous mark (as it is on a linear scale), but the same multiple greater than the previous mark. So if one mark on the axis is 10, and the next is ten times that, or 100, then the next mark after that is again ten times greater, or 1000, and so on.
Now you know all about “exponential growth”, and are prepared to read all sorts of scientific papers (and do sales analysis, too)!
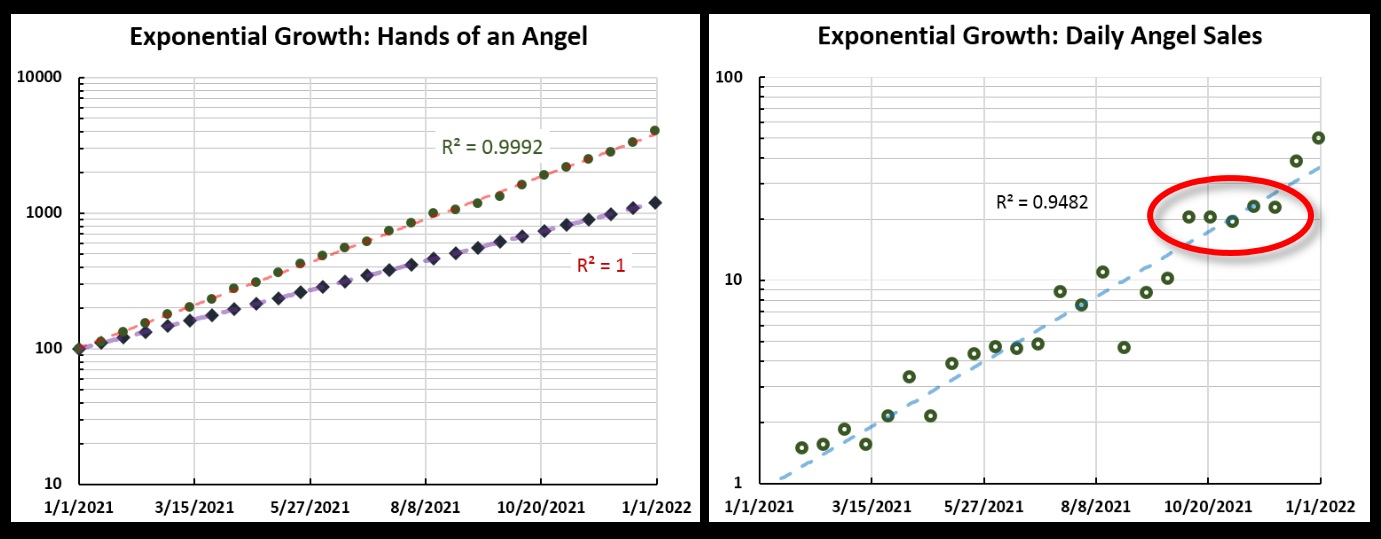 The total sales and daily sales plots for Angel, but on a log scale. Note how clearly the October-December “flat sales” period shows on this graph.